|
Until recently, the only way to produce Time Location charts was by hand, either with pen and paper, or by using a CAD system. This is a long, laborious, time consuming process and, just as the last line or annotation has been drawn, along comes the Project Manager with new ideas or information which requires changes to the programme. ChainLink resolves this problem, Time Location Charts can be produced in minutes using manually entered data or the data from your existing Project Management system. Providing your existing system runs under Microsoft Windows 2000 or above and has the capability of copying the activity data and timings to the Clipboard, usually by means of the Cut or Copy commands, then ChainLink can handle the rest, producing a variety of Time Location Charts on any printer or plotter. |
|
||
|
In addition, data can be imported directly from an interim file such as a Microsoft Project Exchange (MPX) file, a Primavera P3(PRN) file or a Primavera P4/5/6(XER) file. |
|
||
|
Easy to Use |
|
||
|
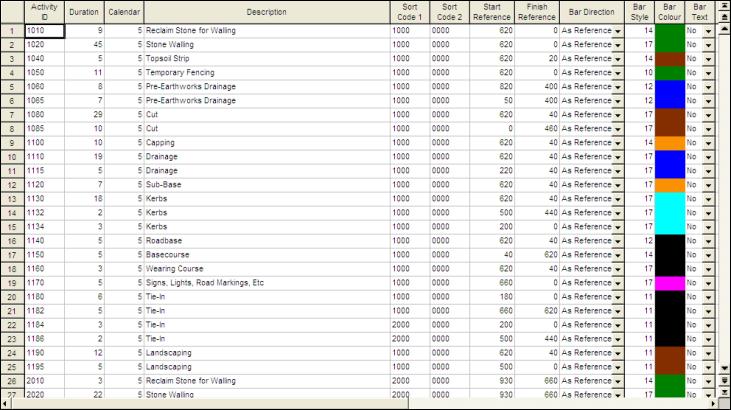
ChainLink has been designed for ease of use all data is entered or edited on a spreadsheet, a format familiar to most computer users. |
|
||
|
|
|
||
|
Toolbars, Popup Menus and Colour Palettes are available to assist with data entry, editing formatting, manipulation and the selection of Line styles, Bar styles and Colours. |
|
||
|
Data Import |
|
||
|
Data may be imported into ChainLink’s simple spreadsheet format either by means of the clipboard or by using the built-in conversion utilities for interim files such as Microsoft Project Exchange (MPX), Primavera P3 Export (PRN) or Primavera P4/5/6 Export (XER) files. |
|
||
|
Design your own Page Layout |
|
||
|
|
|
||
|
ChainLink allows you to design your own page setup and save your design for future use on other projects. |
|
||
|
Format the Chart |
|
||
|
|
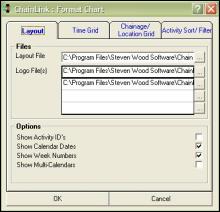
Use the Format Chart utility to personalise your chart.
Select the page layout and your company logo file(s) and select which other items are to be shown on the chart.
Set the time and location grid spacing and the direction, up or down, left to right or right to left in which they are to run.
Sort and filter the activities to be shown using any of the activity data fields.
And, finally, specify the calendar parameters to produce an individually tailored chart to suit the needs of any particular project. |
|
|
|
Enhance the Chart |
|
||
|
Enhance the chart with a choice of over 80 different bar styles ranging from 5 different line styles, through 24 open, hatched and solid bars, boxes and triangles, 5 symbols and 50 user definable bar styles. |
|||
To know more on SWS ChainLink, please click here.
PCO Subject Expert review (In Process)
PCO Members Review
PCO members wishing to share and display their views, please click here